Radar
Radar chart allows to show related data as a polygon spanning on the radar. You can use multiple datapoints to compare different values.
Example
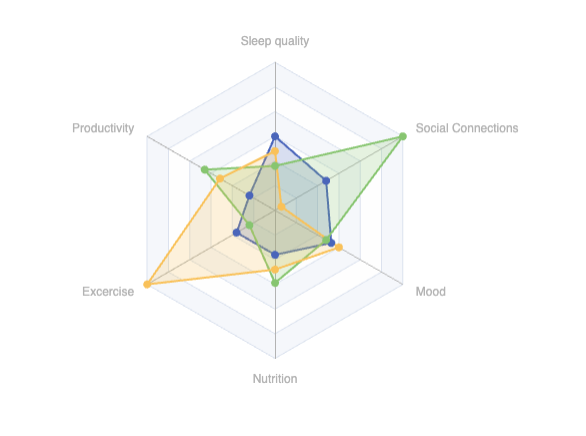
Below is the example of tracking your daily routines accross multiple days:
| Sleepquality | Productivity | Exercise | Nutrition | Mood | Socialconnection |
|---|---|---|---|---|---|
| 50 | 20 | 30 | 30 | 44 | 40 |
| 30 | 55 | 20 | 49 | 40 | 100 |
| 40 | 43 | 100 | 40 | 50 | 5 |
sqlseal
TABLE data = table(0)
CHART {
  radar: {
    indicator: [
		{ name: 'Sleep quality', max: 100 },
		{ name: 'Productivity', max: 100 },
		{ name: 'Excercise', max: 100 },
		{ name: 'Nutrition', max: 100 },
		{ name: 'Mood', max: 100 },
		{ name: 'Social Connections', max: 100 },
    ],
    shape: 'polygon',
    splitNumber: 6,
    },
    series: [{
		type: 'radar',
		areaStyle: { opacity: 0.2 }
    }]
}
SELECT * FROM data