Bar Chart
You can present your data as a Bar Chart
Basic use
| Date | Distance |
|---|---|
| 2025-05-01 | 40.4 |
| 2025-05-02 | 34.43 |
| 2025-05-03 | 43.53 |
| 2025-05-04 | 50.23 |
sqlseal
TABLE t = table(0)
CHART {
	xAxis: {
		type: 'category'
	},
	yAxis: {},
	series: [
		{ type: 'bar' }
	]
}
SELECT * FROM t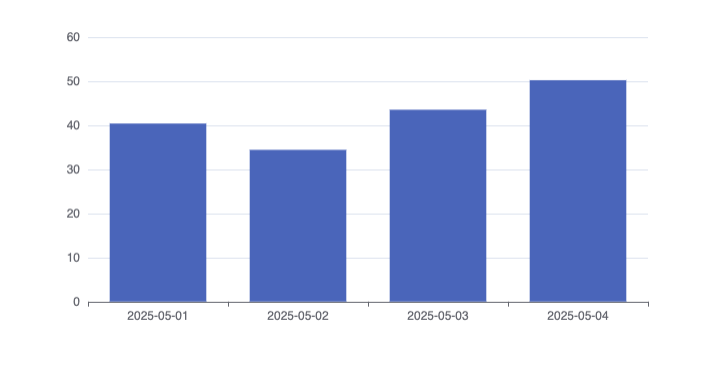
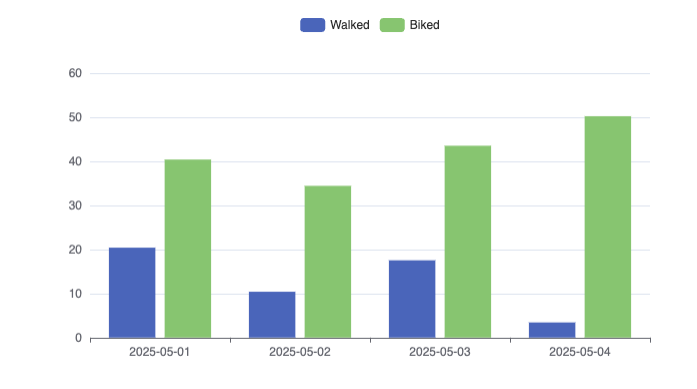
Multiple series
You can show multiple series on the same chart. To do that you need to specify multiple series and define which column name corresponds to the y axis (values). We can also include interactive legend:
| Date | Distance |
|---|---|
| 2025-05-01 | 40.4 |
| 2025-05-02 | 34.43 |
| 2025-05-03 | 43.53 |
| 2025-05-04 | 50.23 |
sqlseal
TABLE t = table(0)
CHART {
	xAxis: {
		type: 'category'
	},
	yAxis: {},
	legend: { show: true },
	series: [
		{
			type: 'bar',
			encode: { y: 'walked' },
			name: 'Walked'
		},
		{
			type: 'bar',
			encode: { y: 'biked' },
			name: 'Biked'
		}
	]
}
SELECT * FROM t