Advanced: Regression
You can compute regression using SQLSeal Charts.
| x | y |
|---|---|
| 1 | 4862.4 |
| 2 | 5294.7 |
| 3 | 5934.5 |
| 4 | 7171 |
| 5 | 8964.4 |
| 6 | 10202.2 |
| 7 | 11962.5 |
| 8 | 14928.3 |
| 9 | 16909.2 |
| 10 | 18547.9 |
| 11 | 21617.8 |
| 12 | 26638.1 |
| 13 | 34634.4 |
| 14 | 46759.4 |
| 15 | 58478.1 |
| 16 | 67884.6 |
| 17 | 74462.6 |
| 18 | 79395.7 |
sqlseal
TABLE regression = table(0)
ADVANCED MODE
CHART
const dataArray = data.map(d => ([d.x, d.y]))
return {
dataset: [
{
id: 'data',
source: dataArray
},
{
transform: {
type: 'ecStat:regression',
config: {
method: 'exponential'
// 'end' by default
// formulaOn: 'start'
}
}
}
],
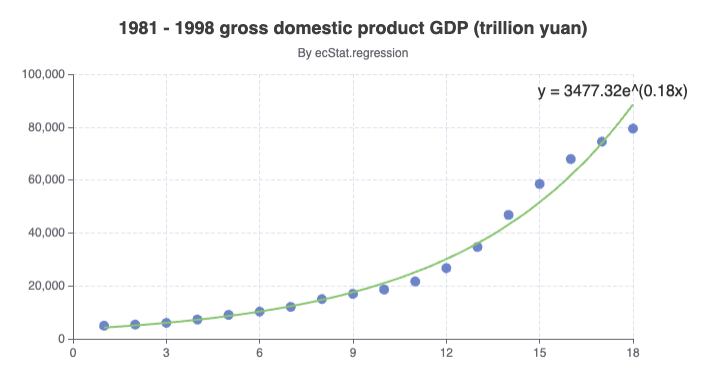
title: {
text: '1981 - 1998 gross domestic product GDP (trillion yuan)',
subtext: 'By ecStat.regression',
sublink: 'https://github.com/ecomfe/echarts-stat',
left: 'center'
},
tooltip: {
trigger: 'axis',
axisPointer: {
type: 'cross'
}
},
xAxis: {
splitLine: {
lineStyle: {
type: 'dashed'
}
}
},
yAxis: {
splitLine: {
lineStyle: {
type: 'dashed'
}
}
},
series: [
{
name: 'scatter',
type: 'scatter',
datasetIndex: 0
},
{
name: 'line',
type: 'line',
smooth: true,
datasetIndex: 1,
symbolSize: 0.1,
symbol: 'circle',
label: { show: true, fontSize: 16 },
labelLayout: { dx: -20 },
encode: { label: 2, tooltip: 1 }
}
]
}
SELECT * FROM regression